Insights
Every single Skybear.NET Script Run generates a comprehensive Run report that is persisted for you automatically and can be viewed at any time.
Skybear.NET processes these reports at the end of each Script Run and publishes comprehensive statistics that provide insights for your Scripts, enabling you to monitor and track the behavior of your services over time.
Open the Insights dashboard by opening any of your scripts, and then clicking the View script insights button in the Results tab selected of the right panel of the page.

Script Runs overview
Skybear.NET Insights provide a per-script overview across recent Script Runs for that script.
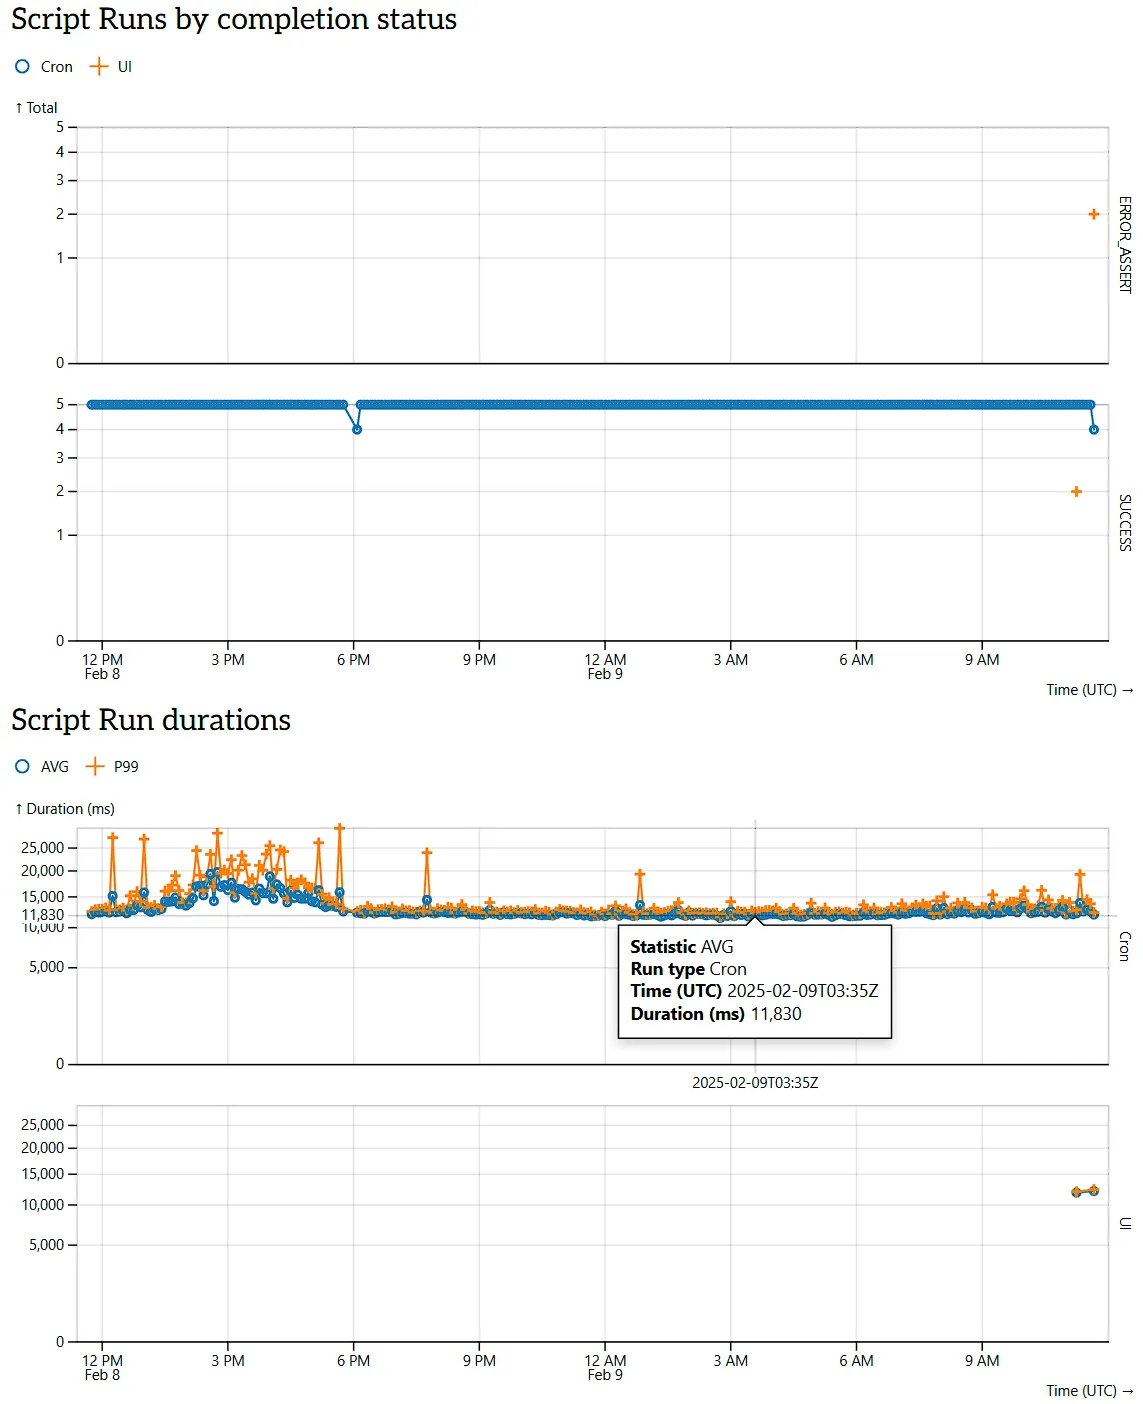
The top graphs plot the number of executed Script Runs over time by trigger (UI, Cron, HTTP), along with their completion status like assert error, syntax error, server error.
Further below you can track the total duration of the Script Runs over time, including average and 99th-percentile (P99).
The duration graphs especially are super useful to monitor your API’s performance over time.
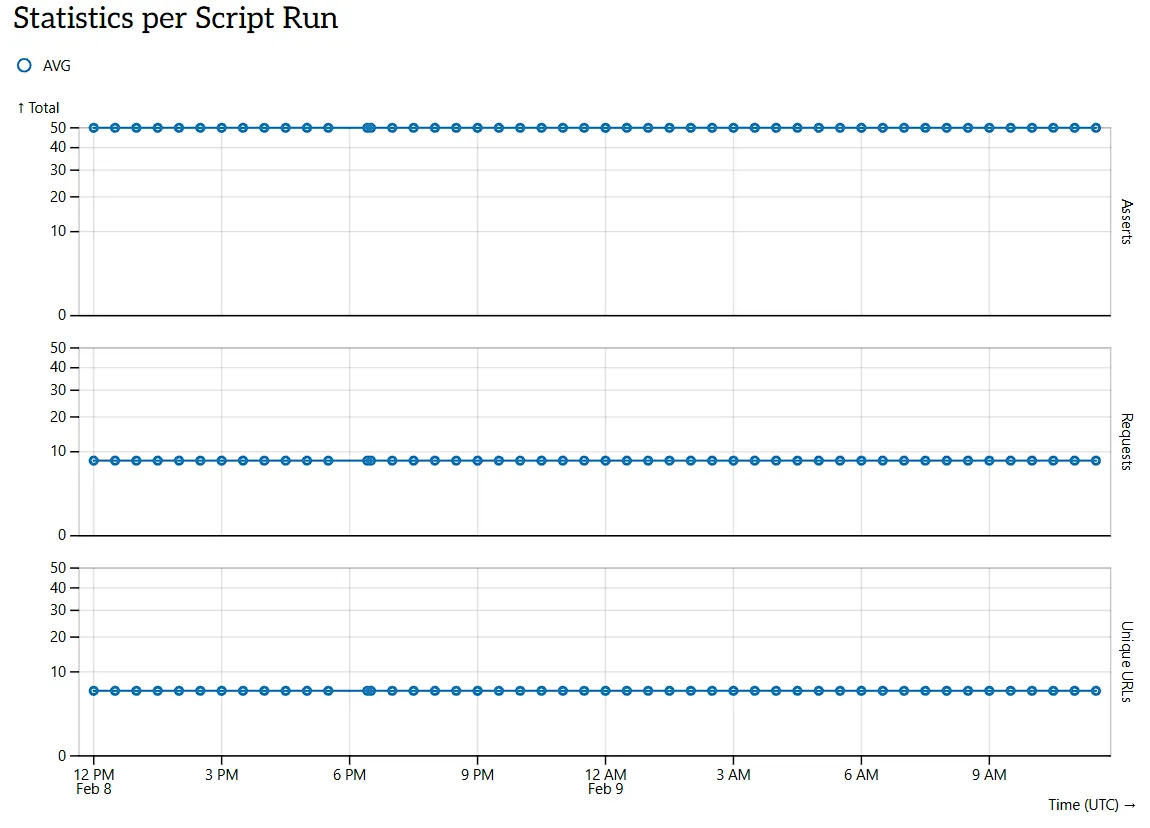
Skybear.NET Insights also provides aggregate statistics across all the Script source files within each Script Run.
These statistics showcase Skybear.NET‘s power and cost-efficiency compared to other tools that charge “per request or API check”.
Within a single Script Run you can do hundreds of HTTP requests, hundreds or thousands of assertions, and accounted only as 1 Script Run.😉
Some of the provided statistics:
- Asserts is the number of asserts done by each Script Run.
- Requests is the number of HTTP requests sent by each Script Run.
- Unique URLs is the number of unique URLs called by your Scripts, including URL domain, path, and query parameters.
In the example screenshot above, each Script Run has done on average 8 requests, 50 asserts, against 6 unique URLs.
Script Runs request drill-down
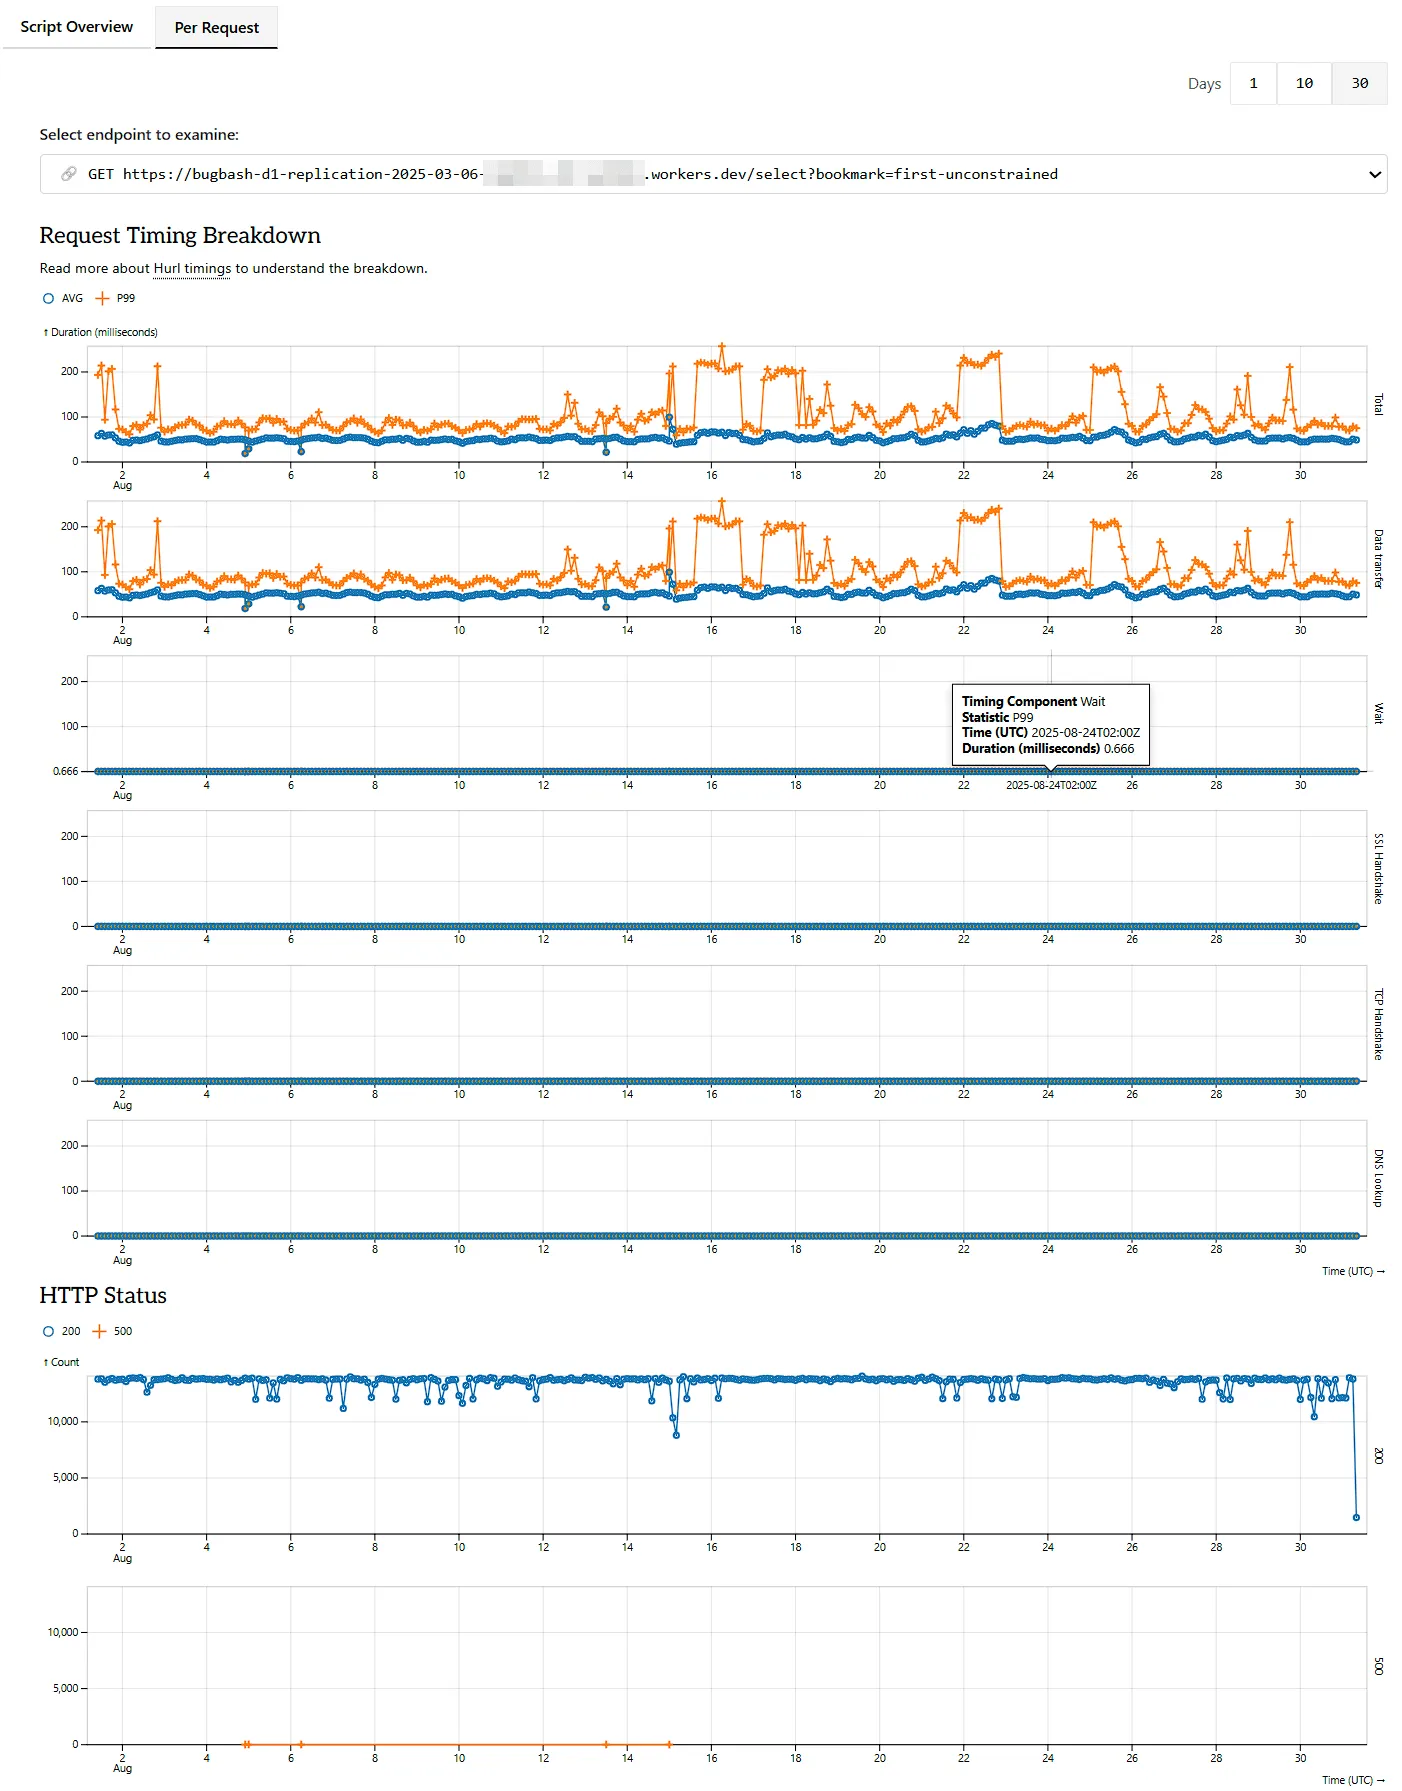
Skybear.NET Insights provides aggregated information with request URL granularity.
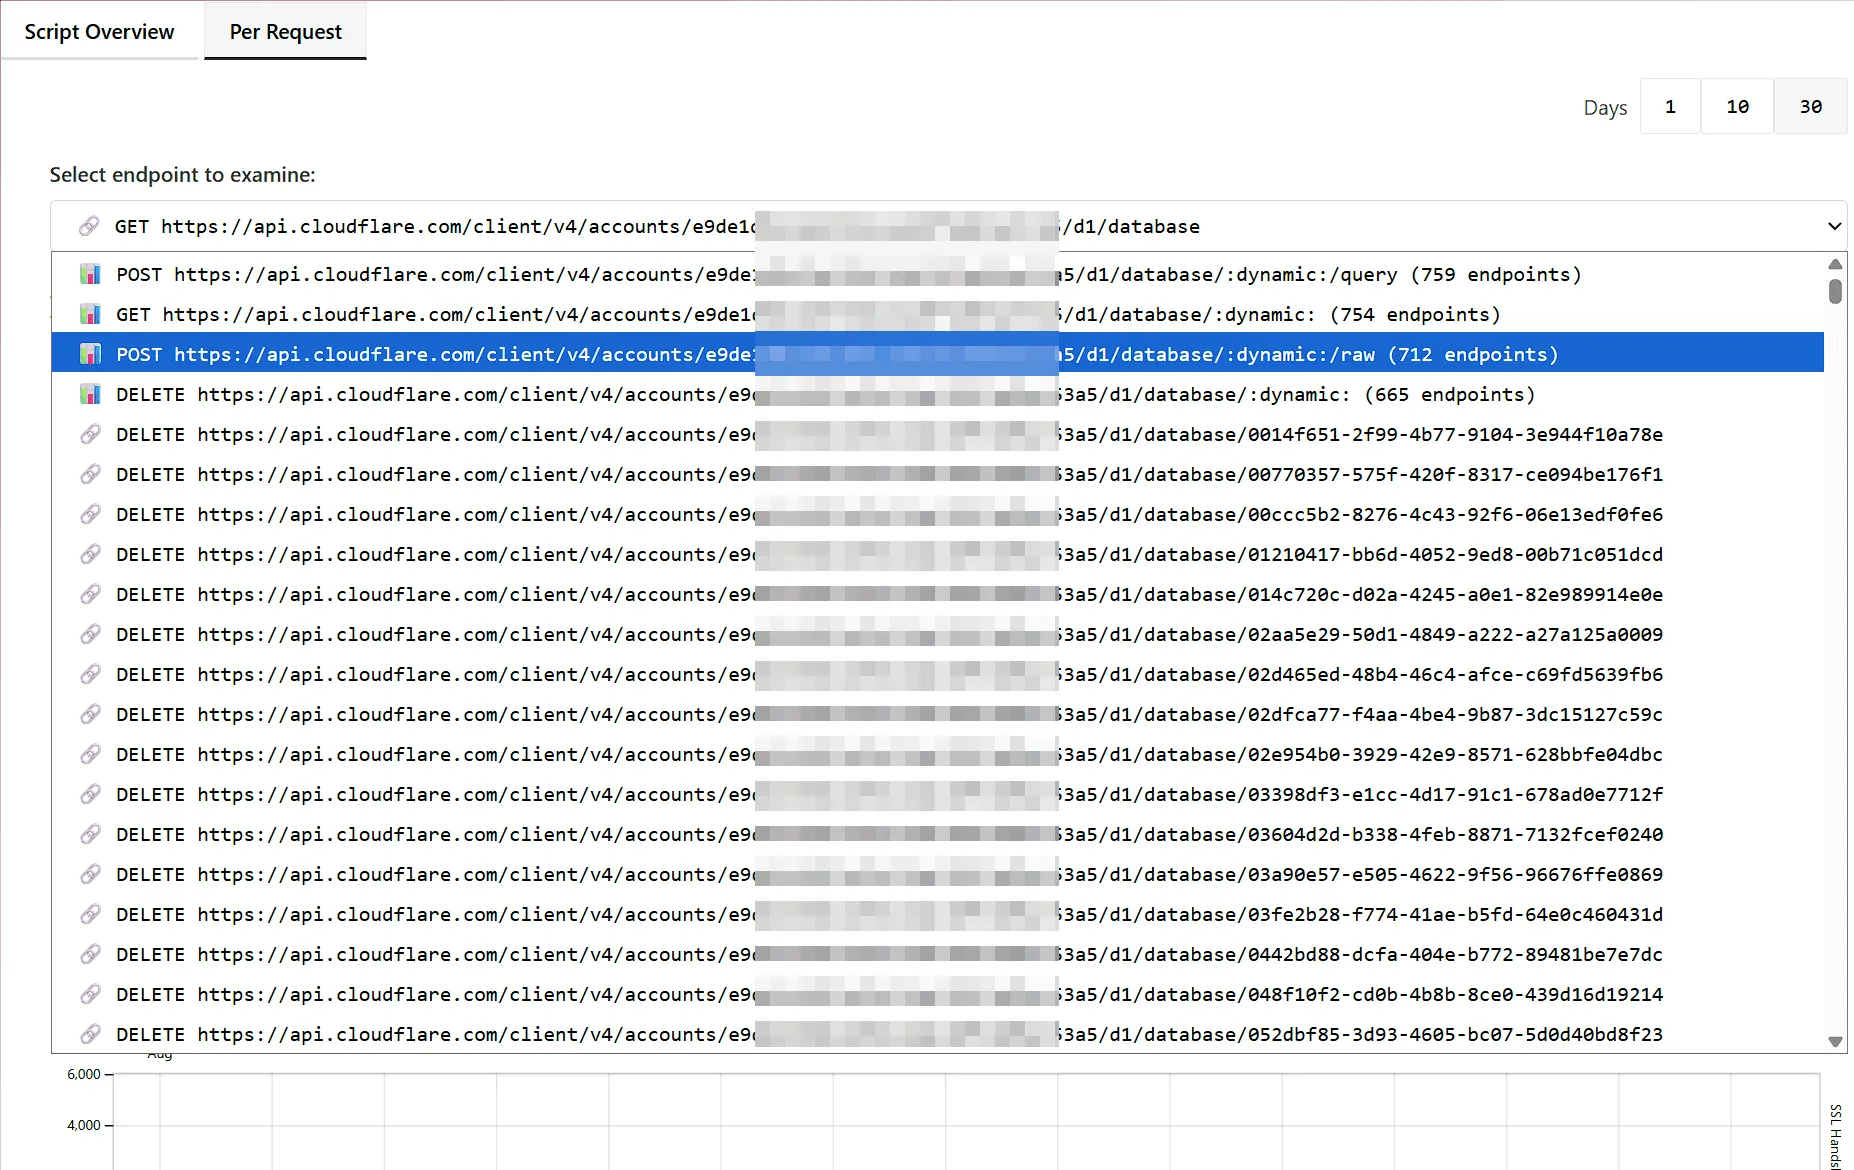
Select specific endpoints and view historical performance metrics, HTTP status responses, and HTTP response sizes.
The per request drill-down dashboard allows you to identify slow or flaky endpoints.
Skybear.NET automatically detects dynamic path segments on the requested URL endpoints and provides aggregated insights for the dynamic endpoints as well, providing useful information at the endpoint level too, in case the tests are using dynamically generated URLs.
Feedback
Skybear.NET Insights are continuously extended with more information. If you have specific feedback or suggestions on what you would like to see for your Scripts, please get in touch, we would love to improve the product with your feedback.🙏🏼